While Homeward Bound Villages is currently focusing on rental properties with our Karwick Village project, we were recently asked why we don’t discuss homeownership options for our lowest-income residents and the innovative solutions often limited by outdated zoning laws. This was a great question and an important part of the affordable housing conversation.
Examining this issue reveals two quick facts: the benchmark is broken, and the product is wrong. Until we fix both simultaneously, the market will continue creating “affordable” housing that most people can’t actually afford, and many will miss the homeownership pathway that truly changes lives.
There is a key number at the heart of nearly every affordable housing policy in the United States. It decides who qualifies for assistance, how rents are determined, which projects receive funding, and which families are left behind. That number is the Area Median Income, or AMI, and the way it’s calculated is quietly worsening the housing crisis.
At the same time, even when housing is technically labeled as “affordable,” it is increasingly being designed in the wrong form: large units, costly to build, priced for households with two incomes and good credit. Most American workers, who fall into the middle-income range of $30,000 to $60,000 annually, are being systematically shut out of both the rental assistance system and the homeownership market. So what does that mean for those who are below middle income?
We will seek answers to these questions as we analyze both issues simultaneously and present a five-part model that, together, makes ownership truly attainable for the households the current system has left behind.
Problem One: The Benchmark Is Broken
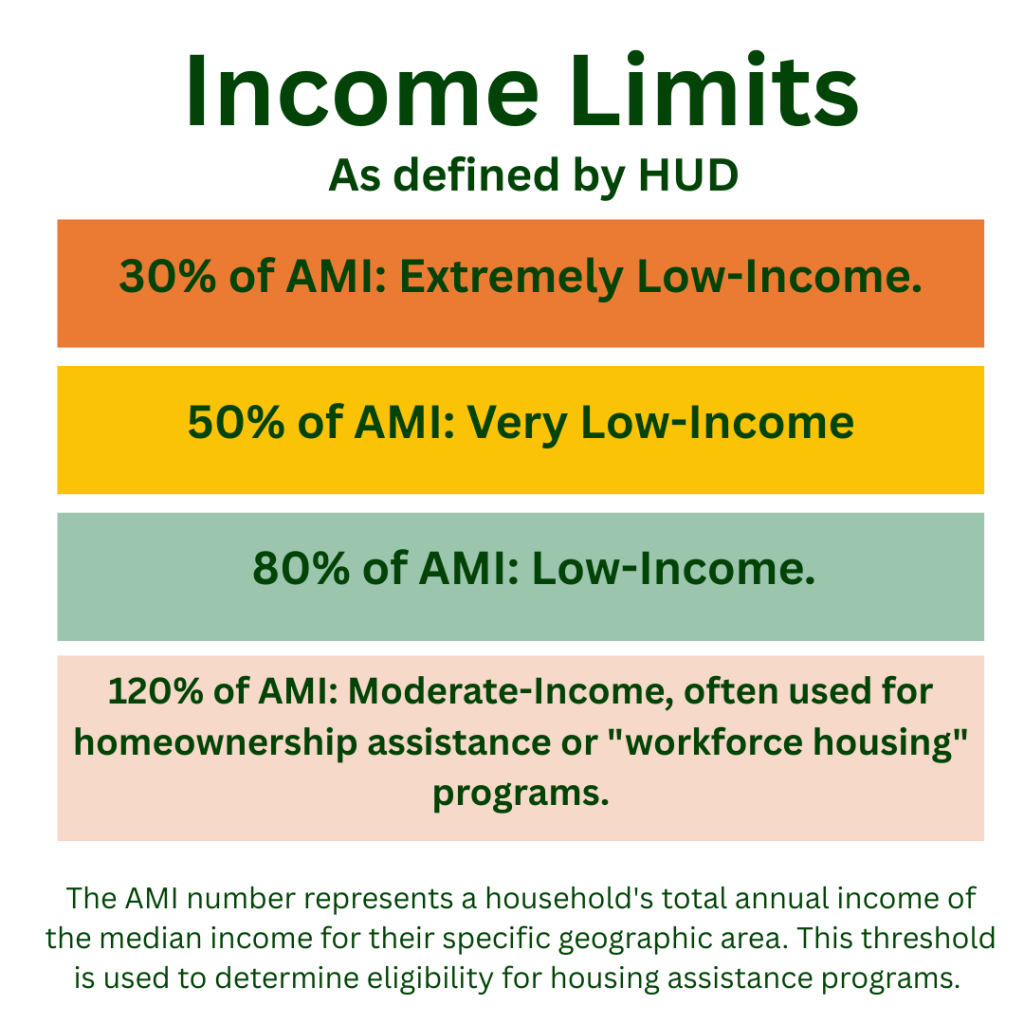
AMI stands for Area Median Income. In theory, it’s simple: gather all households in a metropolitan area, rank them by income, and identify the one in the middle. That household’s income is the AMI. Housing programs then set affordability levels as percentages of that number—such as 30%, 50%, 80%, and 120%—to determine eligibility and what constitutes affordable rent. Here is how HUD categorizes households based on the AMI:
In practice, the calculation is much more complex and less representative of where most households actually stand. HUD doesn’t just use the median income of the city itself; it considers a metropolitan statistical area that often includes surrounding counties, many of which are wealthier than the urban core.
The numbers tell the story, taking New York City as an example. According to a 2025 analysis by the Association for Neighborhood and Housing Development, the 100% AMI for a three-person household is roughly 28% higher than what people actually earn. A family of four can make $162,000 in 2025 and still qualify as “moderate income” under the standard. The gap between AMI and real household incomes grew by nearly $8,000 between 2013 and 2022, and it hasn’t stopped widening, according to New York City’s Department of Housing Preservation and Development.
This isn’t a problem exclusive to New York. The Metropolitan Council, the regional planning agency for the Twin Cities metro area, released a statement on its official affordability limits page and mentioned that staff were authorized in 2022 to formally explore changes to the standard. It states, “the way AMI is calculated and the respective rental limits do not capture the realities of many households being able to afford housing.”
This matters because affordable rents are based on a percentage of AMI. When AMI is inflated beyond what most people earn, the rents in “affordable” units also rise, often to levels that are unaffordable for the very households they are meant to help.
The data on who truly needs help highlights the stark mismatch. According to ANHD’s 2025 AMI Cheat Sheet, 1.47 million New York City renters fall below 80% AMI. Nearly 80% of rent-burdened households in the city earn 50% AMI or less. Yet in 2024, out of approximately 40,000 new housing units built across the five boroughs, only 6,834 were priced at or below 80% AMI. Of those, just 1,622 served households at 30% AMI or below, representing the most severe and widespread need.
New York City serves as the clearest example of a trend across the country: the methods used to measure affordability have diverged so much from actual household incomes that “affordable housing” often no longer means what it appears to.
The Scale of What’s Missing
It’s not just a question of affordability; it is an issue of truly affordable housing stock. This is a nationwide problem that affects the entire U.S. It’s reported in Up for Growth’s 2025 Housing Underproduction in the U.S. that the country currently lacks 3.78 million housing units. For the first time, every state now faces a housing underproduction shortage.
The National Low Income Housing Coalition measures the shortage differently and reports a more alarming figure: a shortfall of 7.1 million rental homes that are both affordable and available to renters with extremely low incomes, specifically those earning at or below 30% of AMI or the federal poverty guideline. For every 100 extremely low-income renter households in the United States, there are only 35 affordable and available rental units. This ratio is consistent across every state and major metropolitan area, according to the National Low Income Housing Coalition.
Problem Two: The Product Is Wrong
Even setting aside the AMI issue, there is a second equally important problem: the type of housing the market currently develops is not suitable for the households that need it most.
The most common new construction in the United States is usually large, expensive, and aimed at households with substantial incomes and assets. Minimum square footage requirements in many areas, set by zoning laws, require larger single-family homes to be built on large lot sizes.
Up for Growth’s analysis found that 90 to 140 million people in the U.S. live where multi-unit housing could be built and offered at prices middle-income households can afford if the policy environment supported it. The market can build homes for this group, but it is being prevented from doing so.
Here’s a practical example: consider what a household earning 60% of the AMI in Indianapolis actually looks like, a family of four making $61,740 per year. According to the standard affordability rule, which suggests spending no more than 30% of gross income on housing, they can afford about $1,544 per month. A 30-year mortgage at that payment, with a modest down payment and current interest rates, can support a home purchase between $180,000 and $210,000. This price range exists in many markets. However, the supply of homes at that price point, in good condition, in stable neighborhoods, built for long-term owner-occupancy, is rapidly decreasing or nearly nonexistent.
The product gap is especially sharp at the small end of the size spectrum. A 550- to 750-square-foot standalone, owner-occupied home built on a monolithic slab foundation, using high-performance energy design and factory-built construction methods, can be delivered for $150,000 to $200,000 in many markets. It is the right product for single-person households, couples without children, and newly forming families currently paying more in rent for less stable housing. It is also the product that zoning, financing, and production systems have made nearly impossible to build at scale.
Why Homeownership, Not Just Housing
Most affordable housing policy focuses on rental housing. That focus is understandable: rental housing can be delivered faster, at lower per-unit cost, and reaches households at lower income levels. But a policy framework and conversations built almost entirely around rental miss the most transformative outcome available to moderate-income households: ownership.
Homeownership is the main way American families build intergenerational wealth. It offers stability that rental housing cannot: a fixed mortgage payment versus ever-changing rent, protection from displacement, and a physical asset that builds equity over time.
The Five-Part Series on Solutions to this Dual Problem
Over the coming weeks, we will introduce a model that addresses both failures simultaneously. Each component focuses on a specific part of the problem. None of them work alone. Together, they create a true pathway to ownership for households earning 60–80% of their actual, unadjusted income.
In blog post #2 in this series, we’ll examine Factory-Built and Modular Construction. Looking at the manufacturing process that makes small, high-quality, affordable standalone homes financially viable. Cities from Cleveland to Boulder to Louisville to Buena Vista, Colorado, are already adopting it. We discuss what works, what is needed for replication, and the policy conditions necessary for success.
Post 3 is about Zoning Reform, examining the deliberate regulatory barrier that makes small-footprint owner-occupied infill homes illegal in most of the country, and the cities and states dismantling it. Auckland, New Zealand, upzoned three-quarters of its residential land in 2016 and saw its housing stock grow by 80,000 units within eight years. Minneapolis saw a 45% increase in permits for small multi-unit buildings in just two years after bundled reform. The lesson is not that reform is easy. It’s that it works when it’s comprehensive.
Post 4 focuses on Community Land Trusts as a permanent way to keep housing affordable. By separating land ownership from building ownership, CLTs lower the purchase price of a home by eliminating land costs and maintain that affordability for future buyers. Indianapolis’s Community Land Trust follows this model, offering a $100,000 homebuyer assistance program for households at 60% AMI. Vermont’s Champlain Housing Trust, started with a $200,000 city investment in 1984, now manages over 3,000 units and provides homes for 8% of Burlington’s households. These programs don’t just help today’s buyers; they serve all buyers forever.
Post 5 provides an overview of Alternative Financing. It explains why traditional mortgage underwriting often fails moderate-income buyers and how CDFIs, Community Development Financial Institutions, use different principles, such as rental payment history, employment stability, and community ties, for underwriting. By 2023, OFN member CDFIs supported the development or rehabilitation of nearly 3 million affordable housing units nationwide and financed $2 billion annually in mortgages. They are not an experiment; they are a functioning system that operates at an insufficient scale.
In Post 6, we pull The Full Picture together. Workforce housing, the integrated model, what cities are doing right, and what political will actually requires.
The housing crisis is clear. We understand its causes: a standard that overestimates affordability, a production system focused on the wrong types of homes, a financing infrastructure that excludes the wrong borrowers, a legal environment that bans the right buildings, and a policy framework that has prioritized rental help over building wealth through ownership.
We also know what fixes it. The evidence isn’t just theoretical. It exists in Burlington, Indianapolis, Auckland, Cleveland, and Buena Vista, Colorado, where practitioners with limited budgets, imperfect tools, and significant political resistance are making ownership work for households that the market has written off.
Sources
U.S. Department of Housing and Urban Development. HUD Income Limits.https://www.huduser.gov/portal/datasets/il.html. See also: ANHD. “New York City’s AMI Problem, and the Housing We Actually Need.”https://anhd.org/report/new-york-citys-ami-problem-and-housing-we-actually-need/
Fannie Mae Multifamily. Sponsor-Dedicated Workforce Housing product page. 22.4 million cost-burdened renter households nationally; 38% rent increase over the prior decade.https://multifamily.fanniemae.com/financing-options/conventional-products/sponsor-dedicated-workforce
Camoin Associates. “Humanizing Data: Area Median Income (AMI) and Affordable Housing Policy.” Updated March 2023.https://camoinassociates.com/resources/humanizing-data-area-median-income-ami-and-affordable-housing-policy/
Community Service Society of New York. “AMI: Visualizing Inequality and Unaffordability with Area Median Income.”https://www.cssny.org/news/entry/new-css-report-offers-first-analysis-of-ami-and-its-impact-on-affordable-ho
ANHD. “New York City’s AMI Problem, and the Housing We Actually Need.” 100% AMI for a three-person NYC household is approximately 28% above actual median household income; gap grew from $18,407 in 2013 to $26,457 in 2022.https://anhd.org/report/new-york-citys-ami-problem-and-housing-we-actually-need/
Norman Oder. “With 2025 Area Median Income up 4.3%, more ‘low-income’ households could earn six figures.” Atlantic Yards/Pacific Park Report. April 2025.https://atlanticyardsreport.blogspot.com/2025/04/with-2025-area-median-income-up-43-more.html
Metropolitan Council (Twin Cities). 2025 Ownership and Rent Affordability Limits.https://metrocouncil.org/Housing/Planning/Affordable-Housing-Measures/Ownership-and-Rent-Affordability-Limits.aspx
ANHD. “How Is Affordable Housing Threatened in Your Neighborhood? 2025.”https://anhd.org/report/how-is-affordable-housing-threatened-in-your-neighborhood-2025/
ANHD. “2025 AMI Cheat Sheet: New Housing Is Not Affordable to the Majority of New Yorkers.”https://anhd.org/report/2025-ami-cheat-sheet-new-housing-is-not-affordable-to-the-majority-of-new-yorkers/
ANHD. “2025 AMI Cheat Sheet” and 2025 Housing Risk Chart.https://anhd.org/report/2025-ami-cheat-sheet-new-housing-is-not-affordable-to-the-majority-of-new-yorkers/
Up for Growth. “2025 Housing Underproduction in the U.S.”https://upforgrowth.org/news_insights/2025-hup/
National Low Income Housing Coalition. The Gap: A Shortage of Affordable Homes. 2024 edition.https://nlihc.org/gap
Multihousing News. “Affordable Housing Trends.” December 2025.https://www.multihousingnews.com/affordable-housing-trends/
NAHRO. “Rethinking Zoning to Increase Affordable Housing.”https://www.nahro.org/journal_article/rethinking-zoning-to-increase-affordable-housing/. See also: Bipartisan Policy Center. “Eliminating Land-Use Barriers to Build More Affordable Homes.”https://bipartisanpolicy.org/article/eliminating-land-use-barriers-to-build-more-affordable-homes/
Up for Growth and MapCraft. “High Housing Underproduction Regions Can Build Middle-Income Housing If Policies Are Supportive.” September 2025.https://upforgrowth.org/news_insights/high-housing-underproduction-regions-can-build-middle-income-housing-if-policies-are-supportive/
Mirror Indy. “Indianapolis Community Land Trust Homeownership Program.” September 2024.https://mirrorindy.org/indianapolis-community-land-trust-homeownership-program-homes/
Bipartisan Policy Center. “Eliminating Land-Use Barriers to Build More Affordable Homes.” White homeownership rate: 73.1%; Black homeownership rate: 40.6%.https://bipartisanpolicy.org/article/eliminating-land-use-barriers-to-build-more-affordable-homes/